TCNA Report
U.S. Ceramic Consumption Up Nearly 10% in 2021

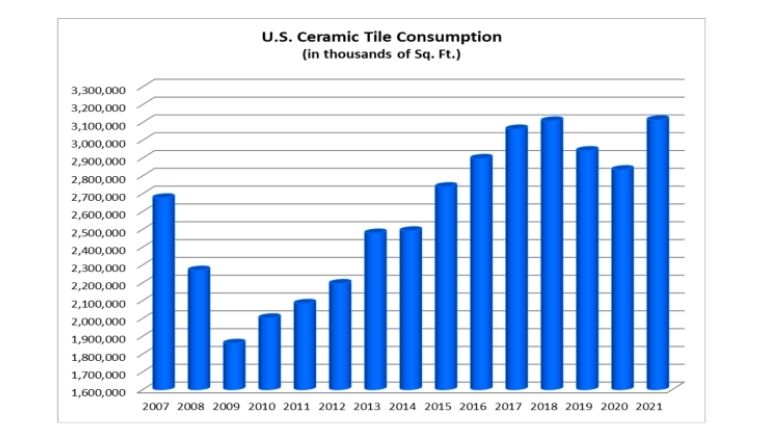
The chart shows total annual U.S. ceramic tile consumption in sq. ft. Graphic: TCNA.

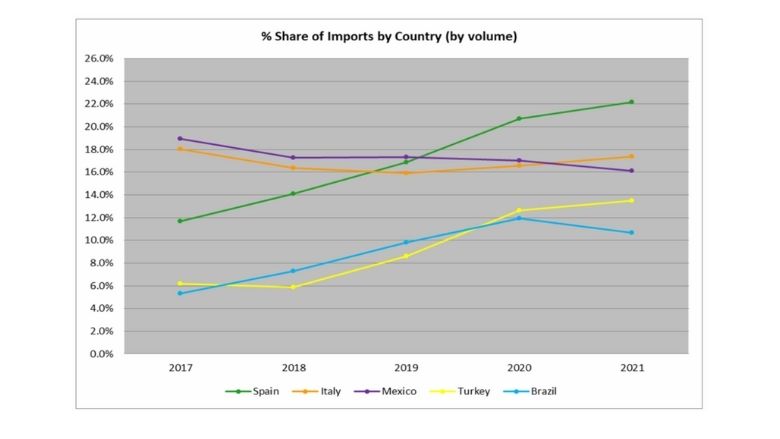
Percentage share of imports by country (volume). Graphic: TCNA.

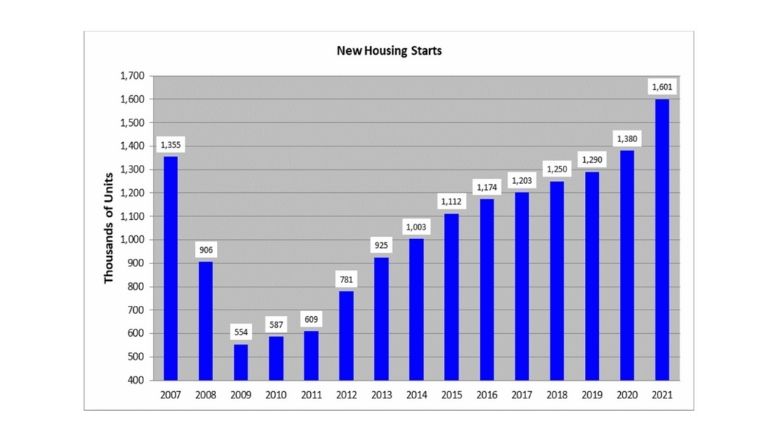
In the residential market, despite supply chain and labor issues, new home starts rose for the twelfth consecutive year and were at their highest point since 2006. The 1.60 million units started in 2021 represented a 16.0% increase from the previous year. Graphic: TCNA.


Supported by gains in the U.S. construction and housing markets and robust overall economic growth, U.S. ceramic tile consumption increased for the first time since 2018, according to the Tile Council of North America (TCNA). At Coverings 2022, TCNA Executive Director Eric Astrachan reported that total U.S. ceramic tile consumption in 2021 was 3.11 billion sq. ft., up 9.9% from the previous year.
The following table shows U.S. ceramic tile shipments, imports, exports, and total consumption in thousands of sq. ft.
| Year | US Shipments (incl. Exports | Imports | Exports | Total Consumption | Change vs. Previous Year |
| 2021 | 918,264 | 2,233,142 | 37,986 | 3,113,421 | 9.9% |
| 2020 | 898,533 | 1,966,443 | 31,009 | 2,833,967 | -3.6% |
| 2019 | 895,332 | 2,077,038 | 31,782 | 2,940,588 | -5.4% |
| 2018 | 940,300 | 2,196,935 | 29,746 | 3,107,489 | 1.5% |
| 2017 | 990,972 | 2,099,307 | 28,492 | 3,061,787 | 5.7% |
*Note: U.S. Shipments + Imports – Exports
The five countries from which the most tiles were imported in 2021 based on volume were:
| Country | Sq. Ft. 2021 | Sq. Ft. 2020 | % Change |
| Spain |
495,564,193 |
407,249,860 |
21.7% |
| Italy | 388,225,617 | 325,939,270 | 19.1% |
| Mexico | 359,595,768 | 335,246,651 | 7.3% |
| Turkey | 300,873,685 | 248,851,082 | 20.9% |
| Brazil | 238,513,562 | 234,794,244 | 1.6% |
| All Countries | 2,233,142,091 | 1,966,443,251 | 13.6% |
On a dollar basis (CIF + duty) Italy remained the largest exporter to the U.S. making up 31.6% of 2021 U.S. imports, followed by Spain (25.3% share) and Mexico (9.8% share).
The five countries that exported the most tiles to the U.S. in 2021 based on total U.S. $ value (CIF + duty) were:
| Country | Total $ Value 2021 | Total $ Value 2020 | % Change |
| Italy | 790,675,424 |
628,564,234 |
25.8% |
| Spain | 633,944,124 | 468,556,063 | 35.3% |
| Mexico | 244,896,355 | 223,989,682 | 9.3% |
| Turkey | 227,643,808 | 187,703,524 | 21.3% |
| Brazil | 171,157,677 | 150,568,515 | 13.7% |
| All Countries | 2,502,773,371 | 2,002,787,363 | 25.0% |
The average values of tile (including CIF + duty) from the five countries that exported the most tiles to the U.S. in 2021 based on volume were:
| Country | Sq.Ft. 2021 | Tot Val 2021 | Val/Sq.Ft 2021 | Val/Sq. Ft 2020 |
| Spain | 495,564,193 |
633,944,124 |
$1.28 | $1.15 |
| Italy | 388,225,617 |
790,675,424 |
$2.04 | $1.93 |
| Mexico | 359,595,768 |
244,896,355 |
$0.68 | $0.67 |
| Turkey | 300,873,685 |
227,643,808 |
$0.76 | $0.75 |
| Brazil | 238,513,562 |
171,157,677 |
$0.72 | $0.64 |
| All Countries | 2,233,142,091 |
2,502,773,371 |
$1.12 | $1.02 |
U.S. Shipments
U.S. manufacturers shipped 880.3 million sq. ft. of ceramic tile domestically last year, a 1.5% increase from 2020. Though imports’ share of U.S. consumption grew from 69.4% in 2020 to 71.7% last year, domestically-produced tiles’ share of consumption (28.3%) remained far ahead of all other individual countries exporting tile to the U.S., with the nearest being Spain (15.9% of U.S. tile consumption), Italy (12.5%), and Mexico (11.5%). In dollars, 2021 U.S. FOB factory sales of domestic shipments were $1.36 billion, a 5.0% increase from 2020. U.S. shipments comprised 35.2% of 2021 total U.S. tile consumption by value, down from 39.3% the previous year. The per unit value of domestic shipments increased from $1.49/sq. ft. in 2020 to $1.54/sq. ft. last year.
U.S. Exports
U.S. ceramic tile exports in 2021 were 38.0 million sq. ft., a 22.5% increase from the previous year. The two largest consumers of U.S. exports by volume were Canada (70.7%) and Mexico (14.3%). The value of U.S. exports rose 29.8% from $31.2 million in 2020 to $40.4 million last year, according to the U.S. Department of Commerce.
Housing Market Highlights
In the residential market, despite supply chain and labor issues, new home starts rose for the twelfth consecutive year and were at their highest point since 2006. The 1.60 million units started in 2021 represented a 16.0% increase from the previous year, according to the U.S. Census Bureau.
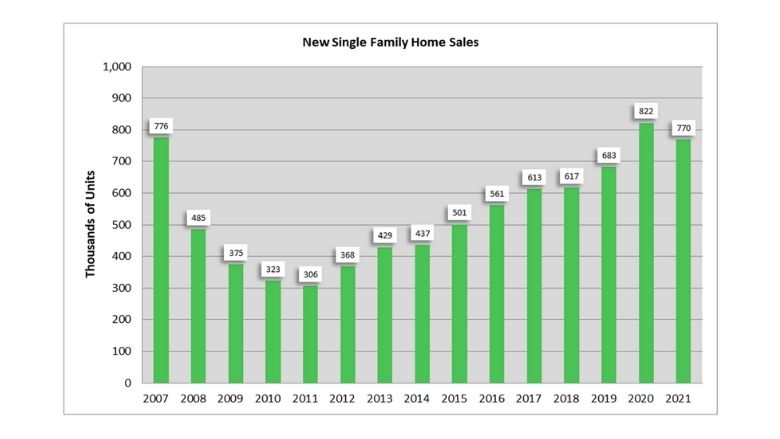
With record-high average new home prices and a low supply of available properties, new single-family home sales fell for the first time in a decade. The 770,000 units sold in 2021 represented a 6.3% decline from the previous year, according to the U.S. Census Bureau.
"Import issues: I'm probably telling you what you've seen every day in the news: freight costs and container shortages, gas prices in Europe, which is a significant issue and a challenge for European tile producers, which they consider a crisis," Astrachan said. "The good news is it's driving a lot of discussion and new technology using clean hydrogen—what they call clean gas—hydrogen gas combined with natural gas or full electric kilns. The technology is in process, but is not yet implemented."
Other factors include raw material supply disruption from Ukraine, which is one of the largest producers in clay for Europe, limited ability to raise prices because the price of the U.S. is driven by many other things. "It means the best possible time to build tile factories in North America," Astrachan said.
Looking for a reprint of this article?
From high-res PDFs to custom plaques, order your copy today!


